Summary
All entries can be filtered by time, clients, and other parameters.
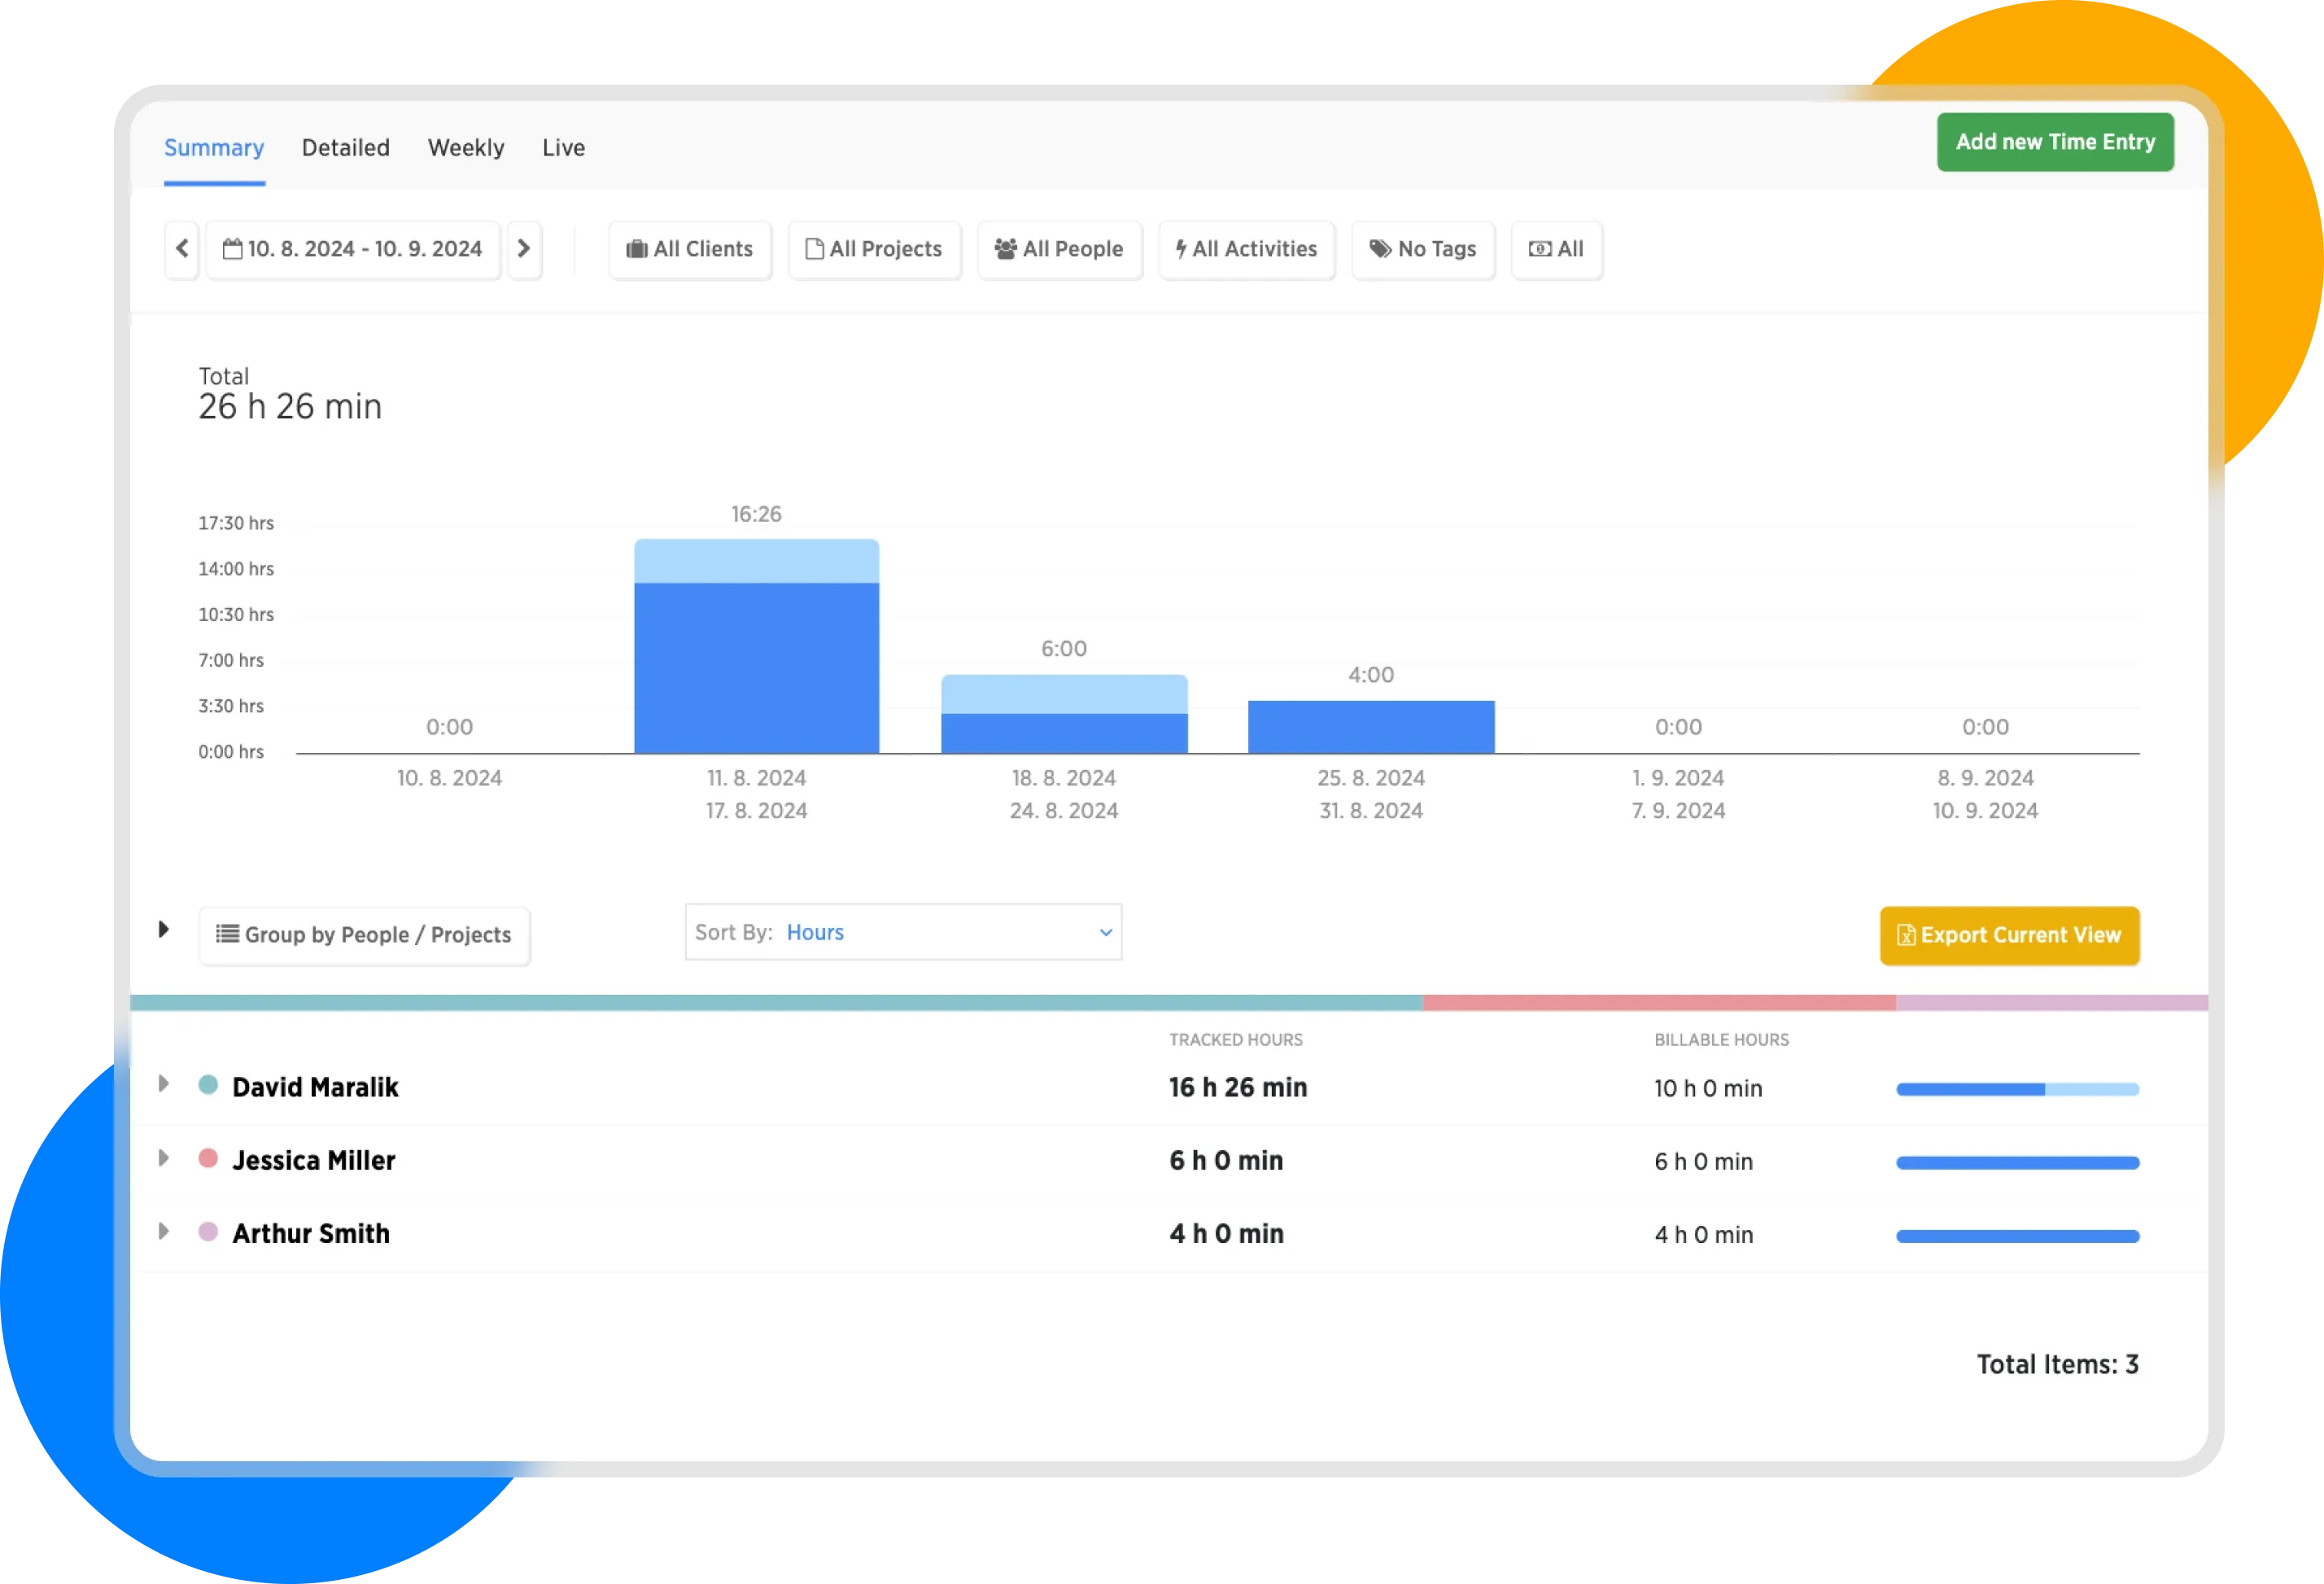
Timesheet - Summary
A few important pieces of information about Summary:
How do I know which hours are Billable/Non-Billable?
The graph distinguishes billable and non-billable hours by different colors:
- Light Blue indicates non-billable hours.
- Dark Blue indicates billable hours.
When hovering over the graph, numerical representations of total and billable hours are displayed.
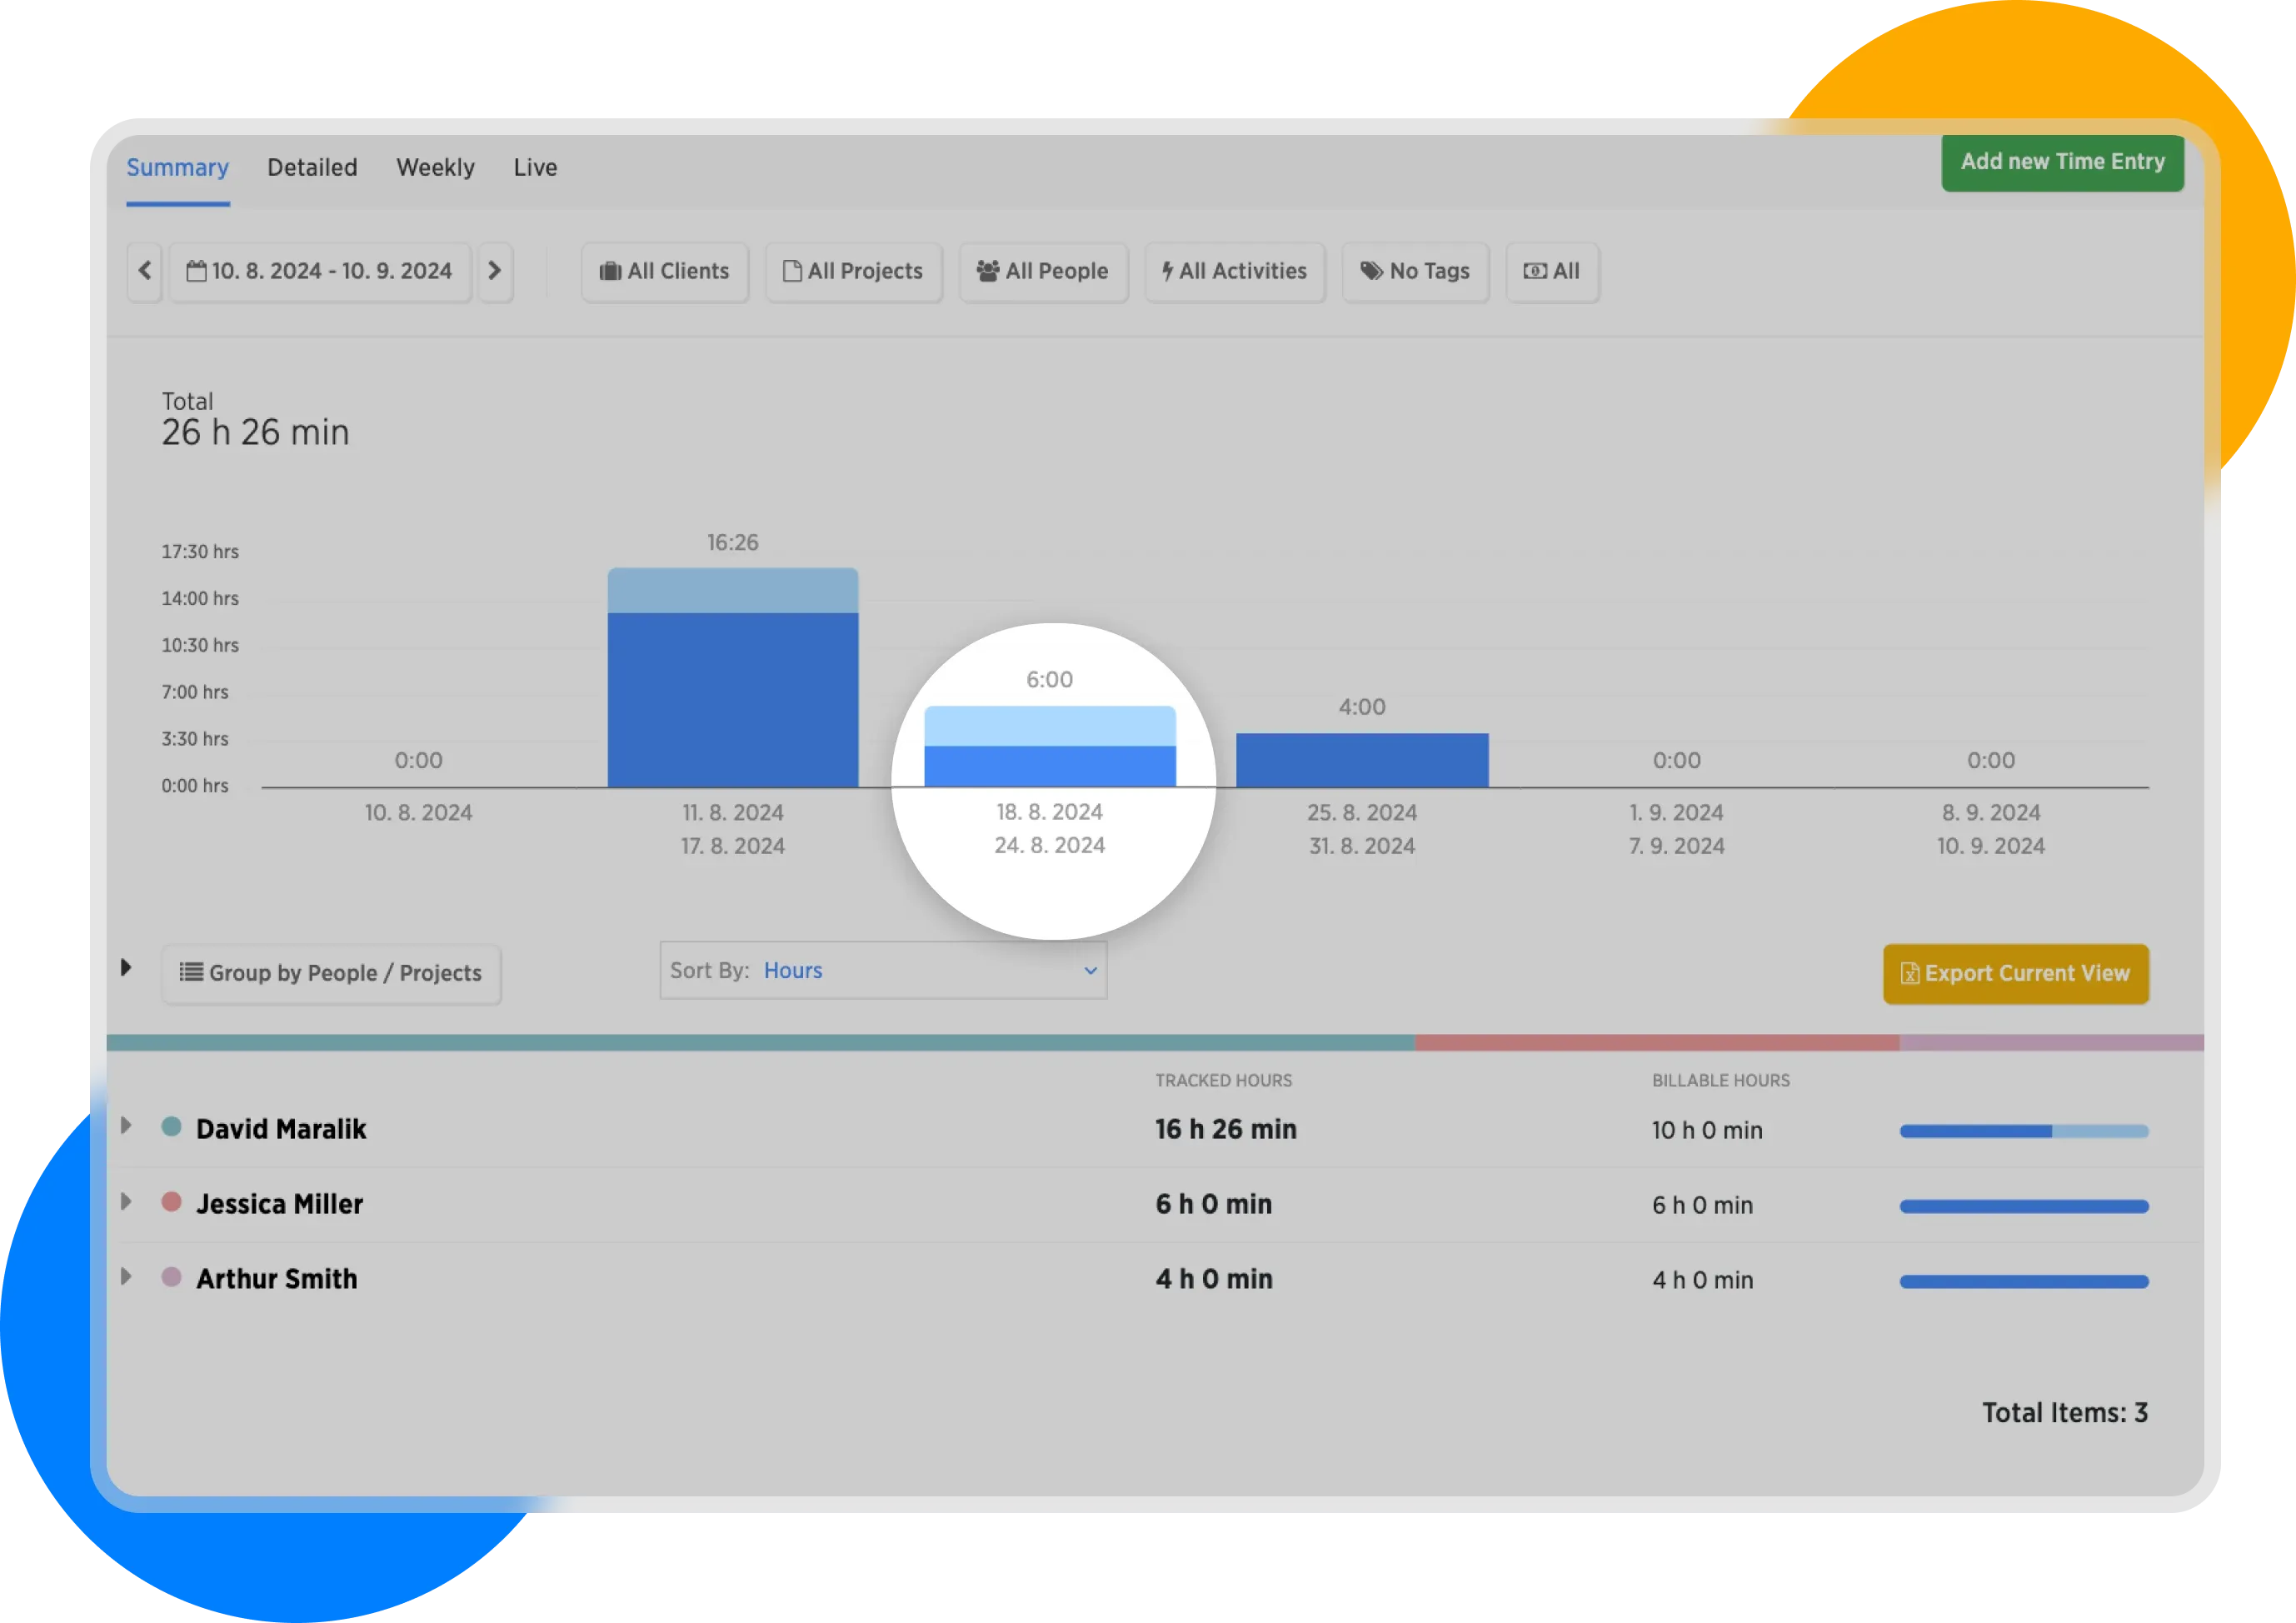
Detailed chart of billable and nonbillable hours
Summarizing Data from Different Perspectives
Using the Group by button, we can switch views of data from different perspectives.
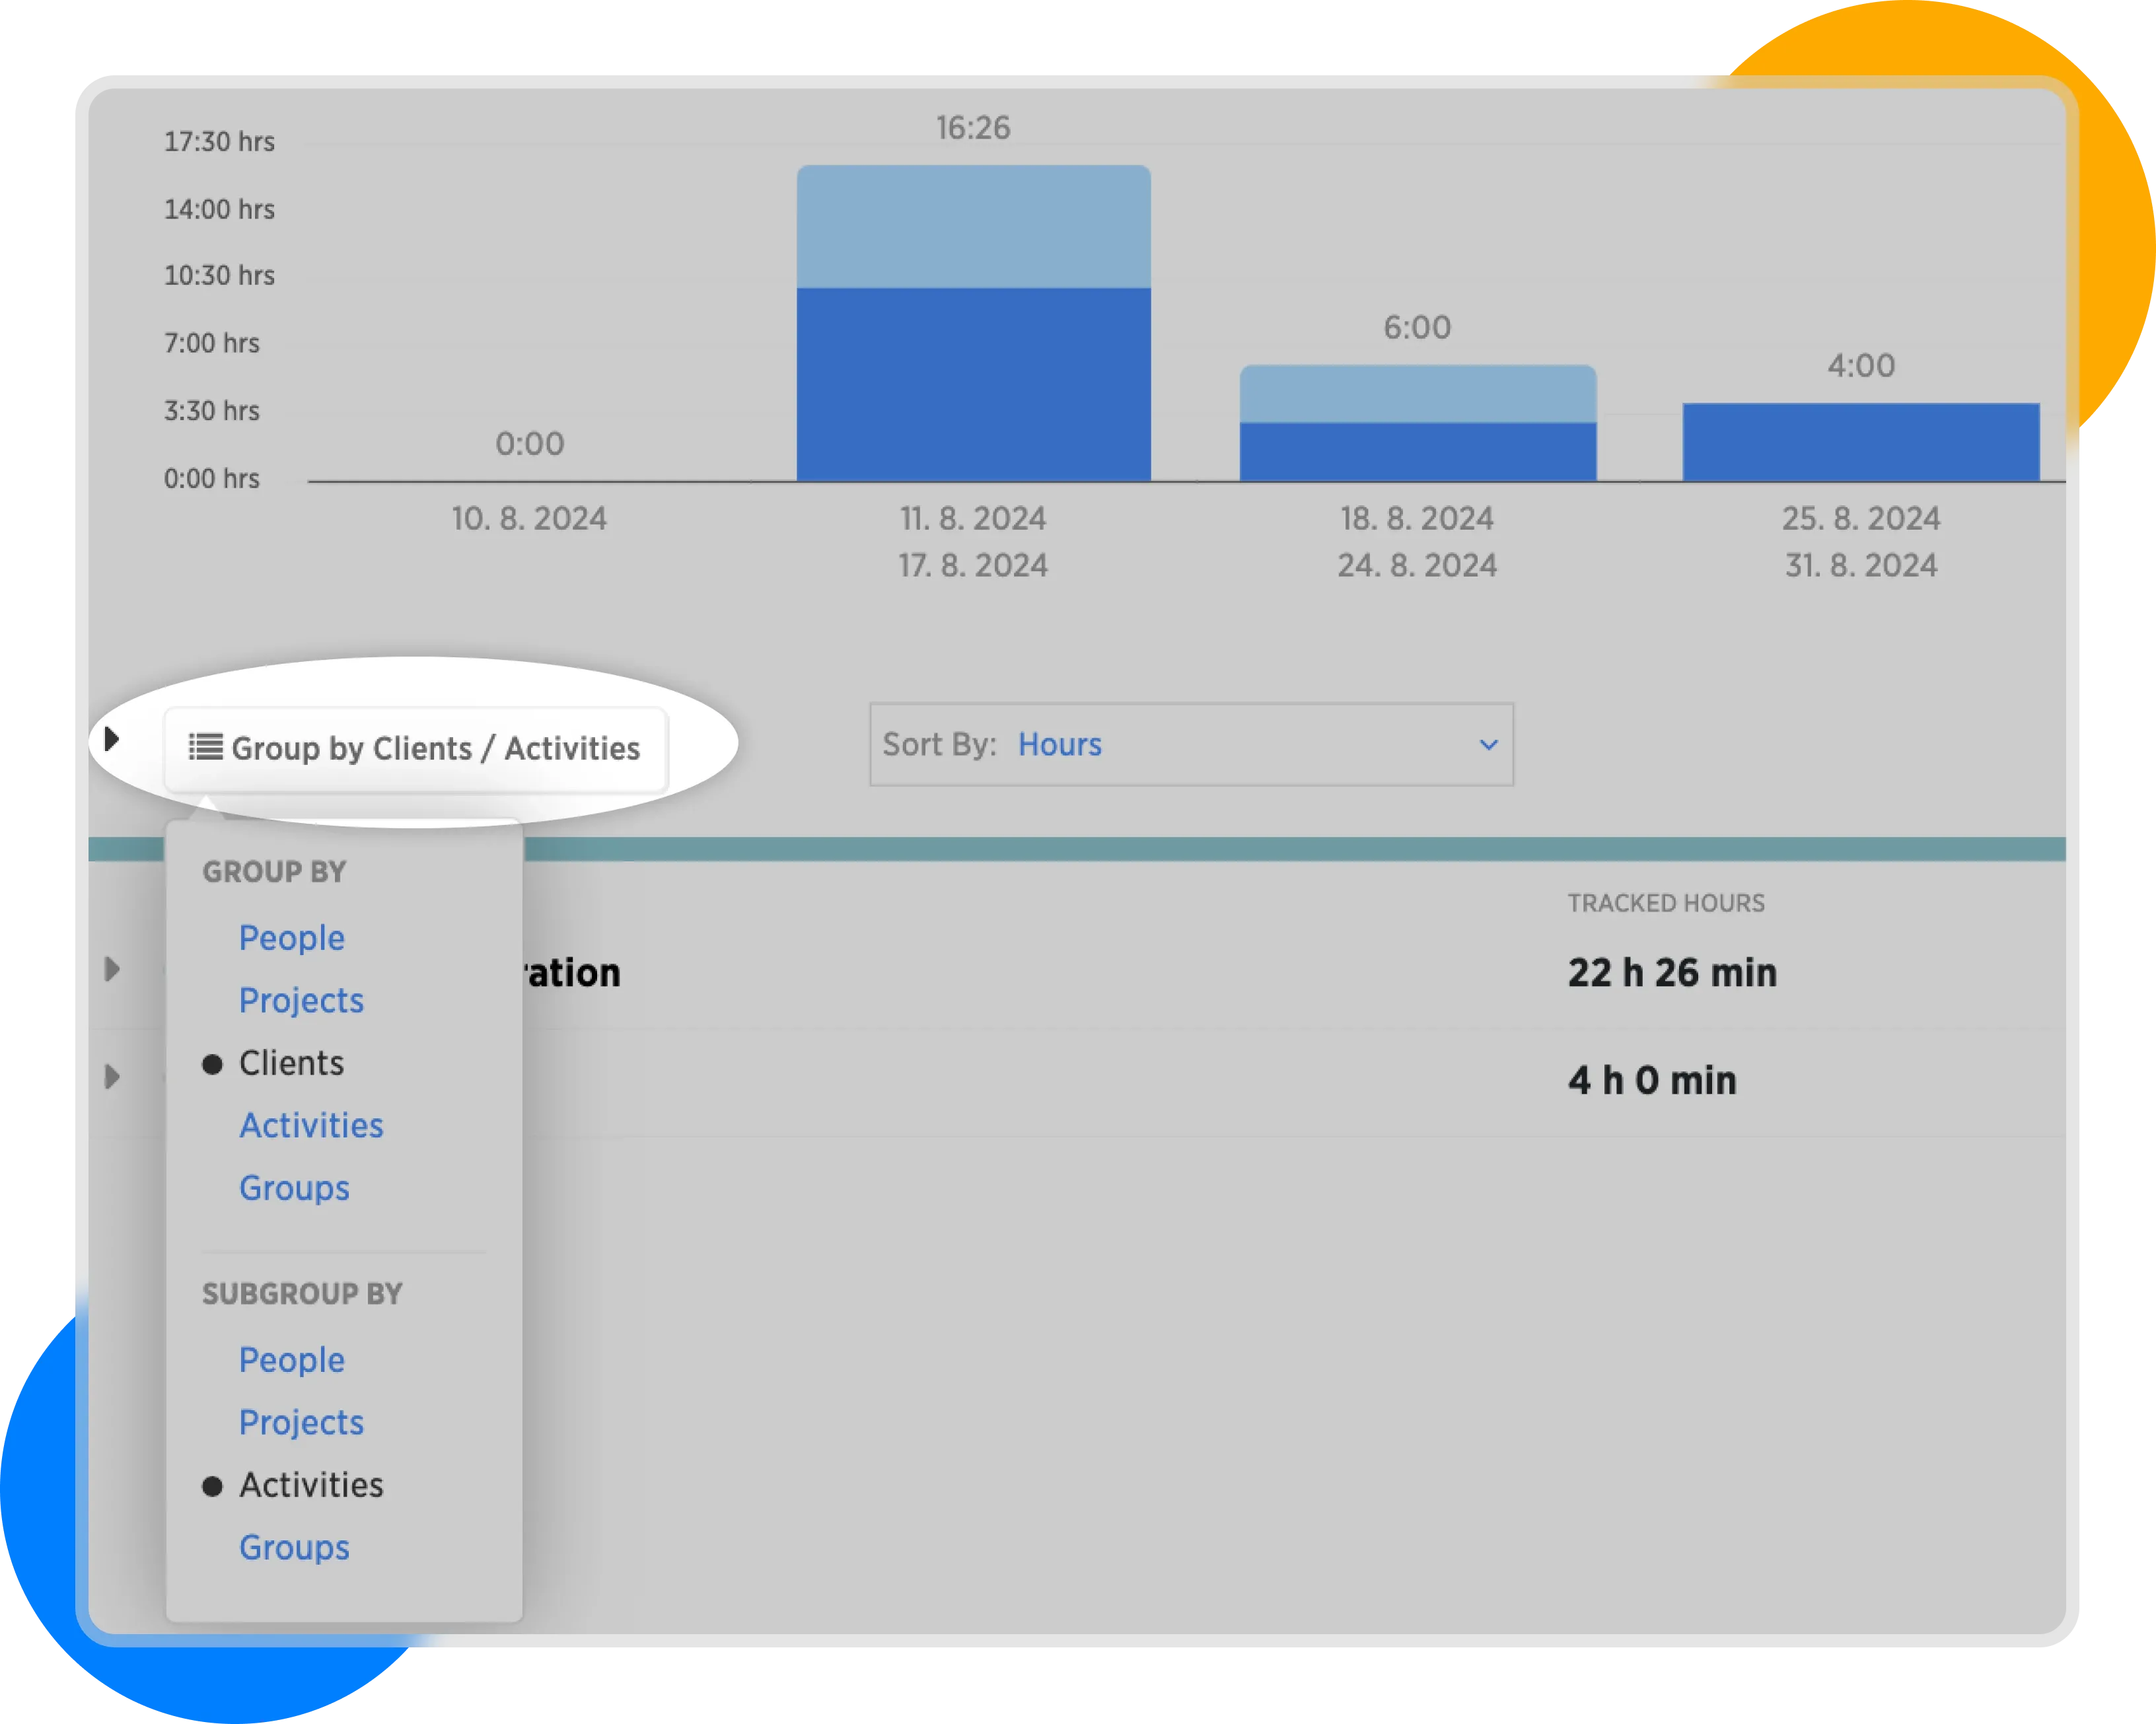
Choosing a timesheet grouping select
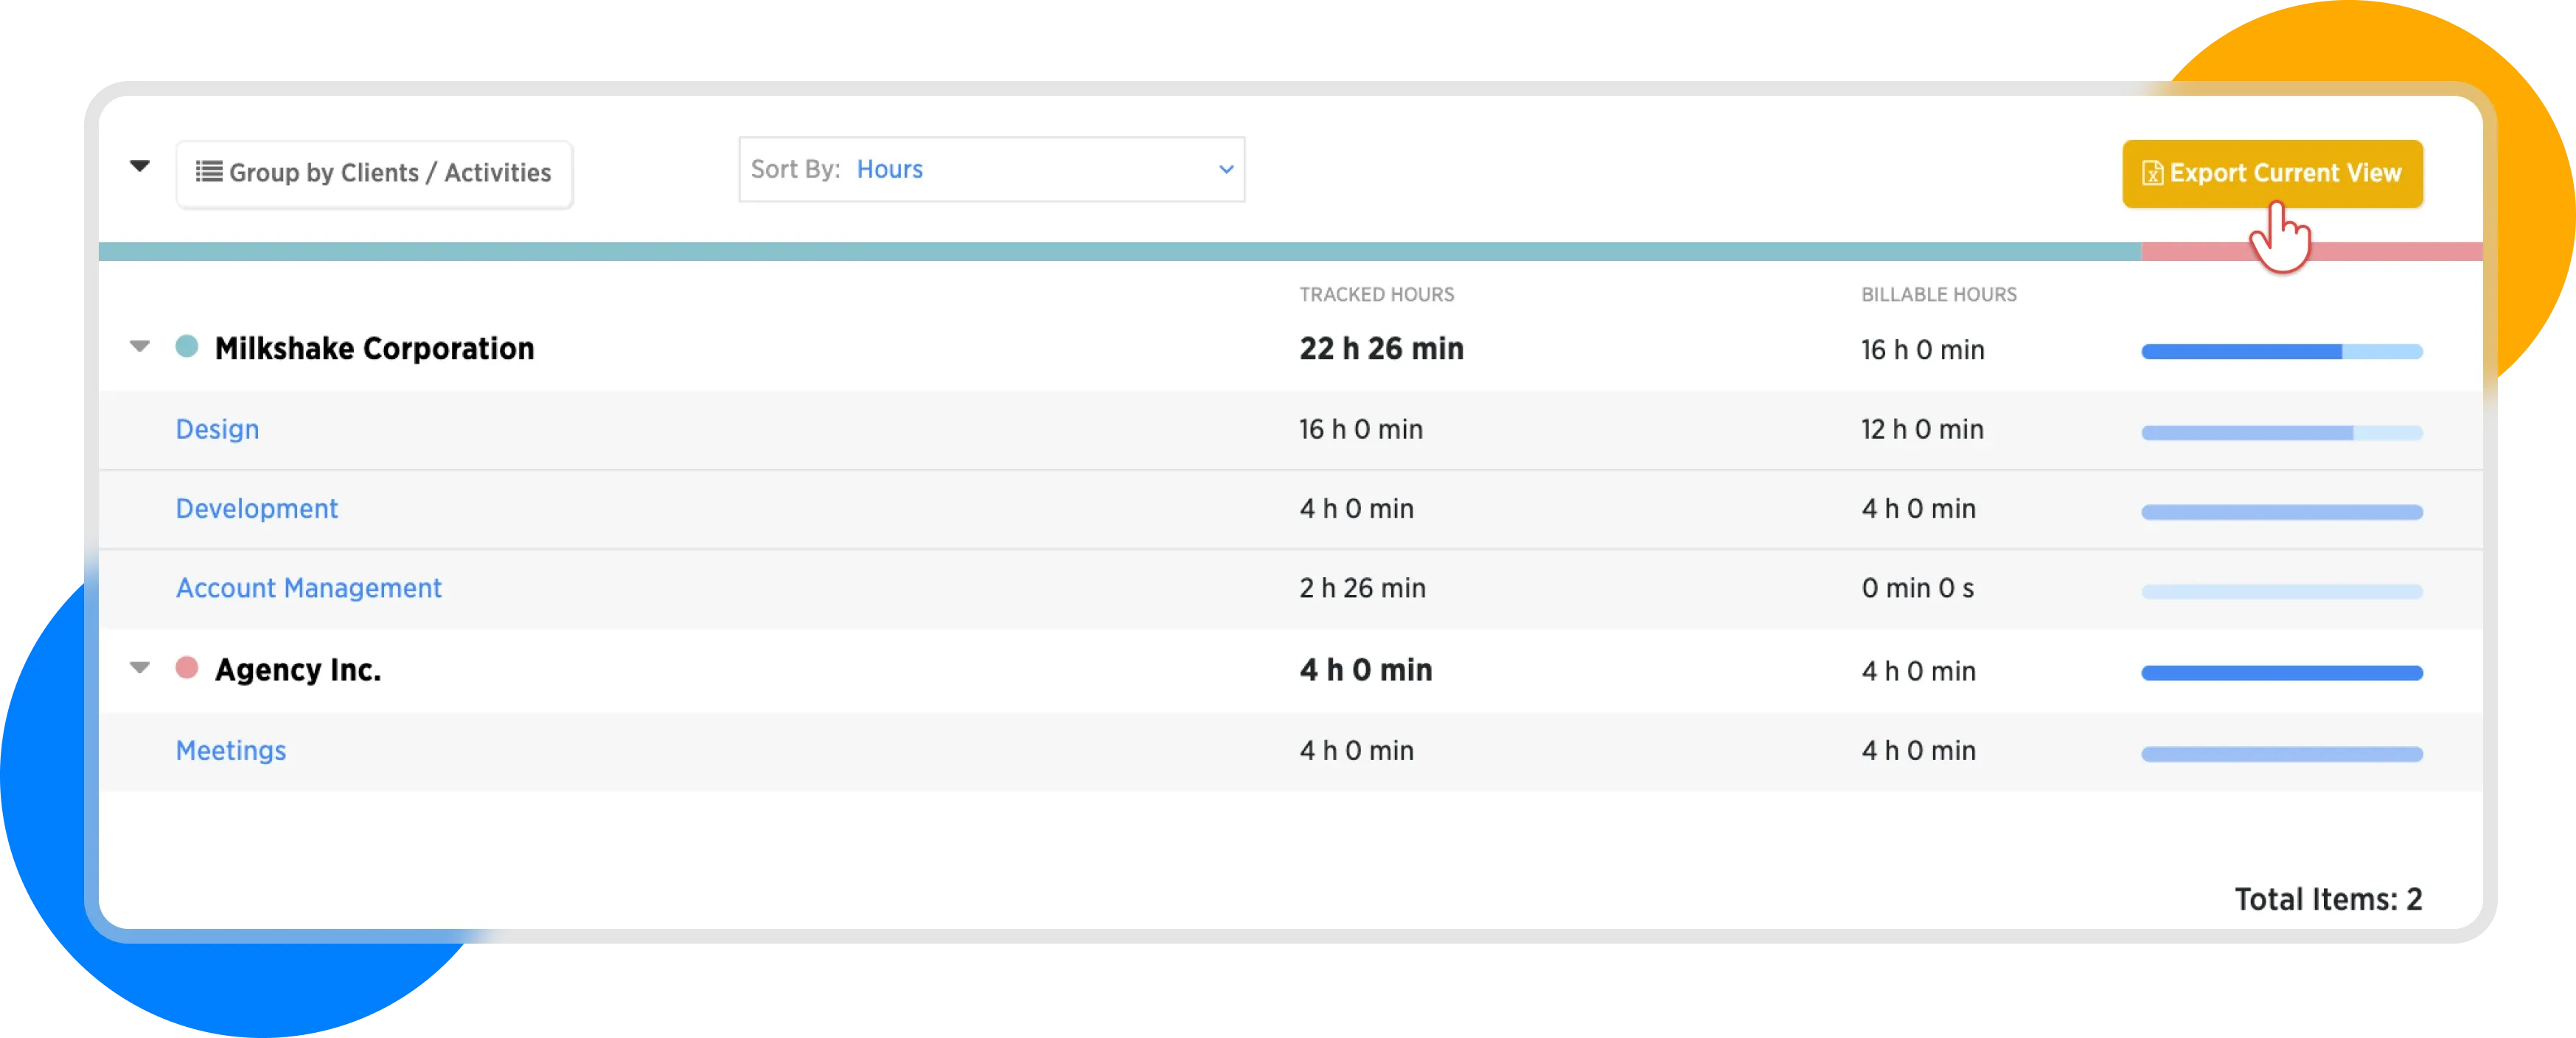
For example, grouping data by Client and Activity, as shown in the following example:
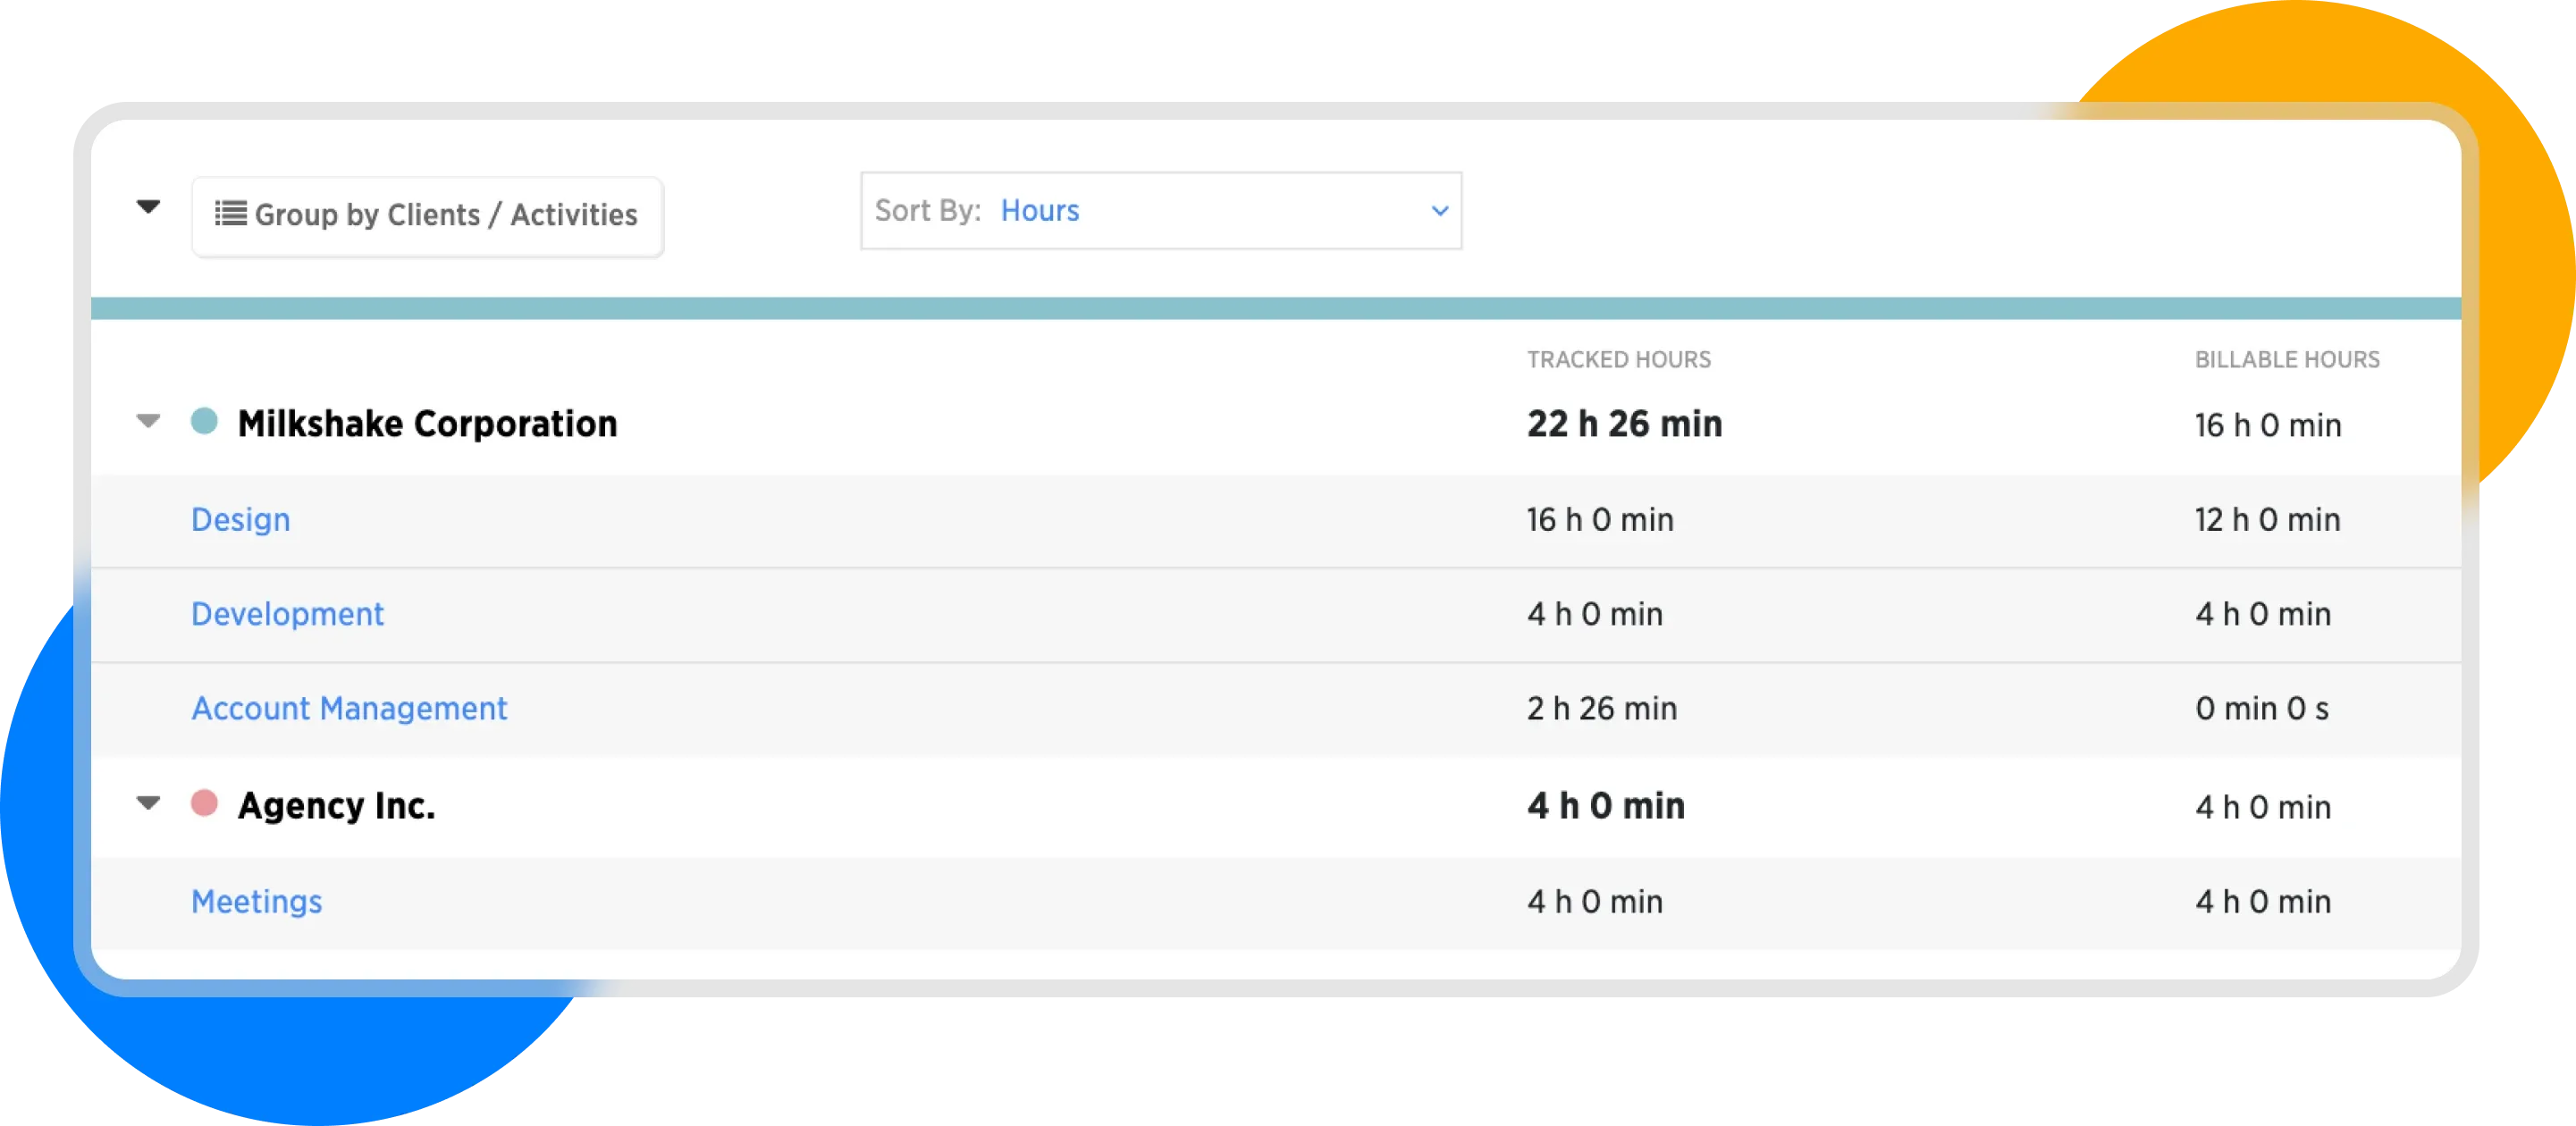
Grouping data by Clients and Activities
Exporting Data
Any view can be exported to XLSX (MS Excel) format and sent to the client or used for further analysis.
Timesheet - Export Current View
Live
The Live view displays an overview of all currently active employees with information on which task they currently have time tracking enabled. When hovering over a record, details about the task, including the description, are displayed.
Weekly
The Weekly view provides us with a clear table summarizing the hours that employees have spent on individual days within a week.